QUARTERLY BUSINESS PERFORMANCE OVERVIEW
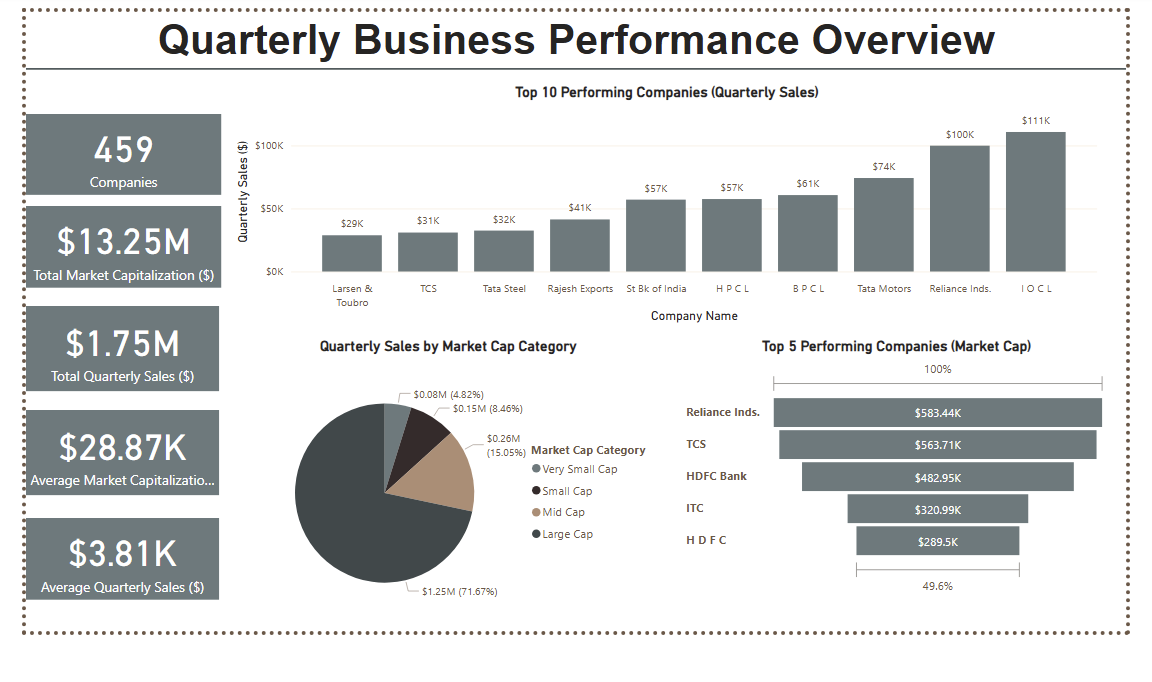
A data‑driven look at Q1 performance across 459 public companies, highlighting market capitalization, sales distribution by cap‑tier, and standout industries driving value and growth.
VIEW INSIGHTSThis section highlights my work with Power BI, where raw data is transformed into interactive, insightful dashboards. From business analytics to performance tracking, these projects demonstrate how visual storytelling can drive smarter decisions.
Each report is designed with clarity, usability, and impact in mind—turning numbers into narratives.
A data‑driven look at Q1 performance across 459 public companies, highlighting market capitalization, sales distribution by cap‑tier, and standout industries driving value and growth. An in-depth exploration of mathematics performance among 394 secondary school students, uncovering how socio-economic background and learning conditions shape academic success.
QUARTERLY BUSINESS PERFORMANCE OVERVIEW
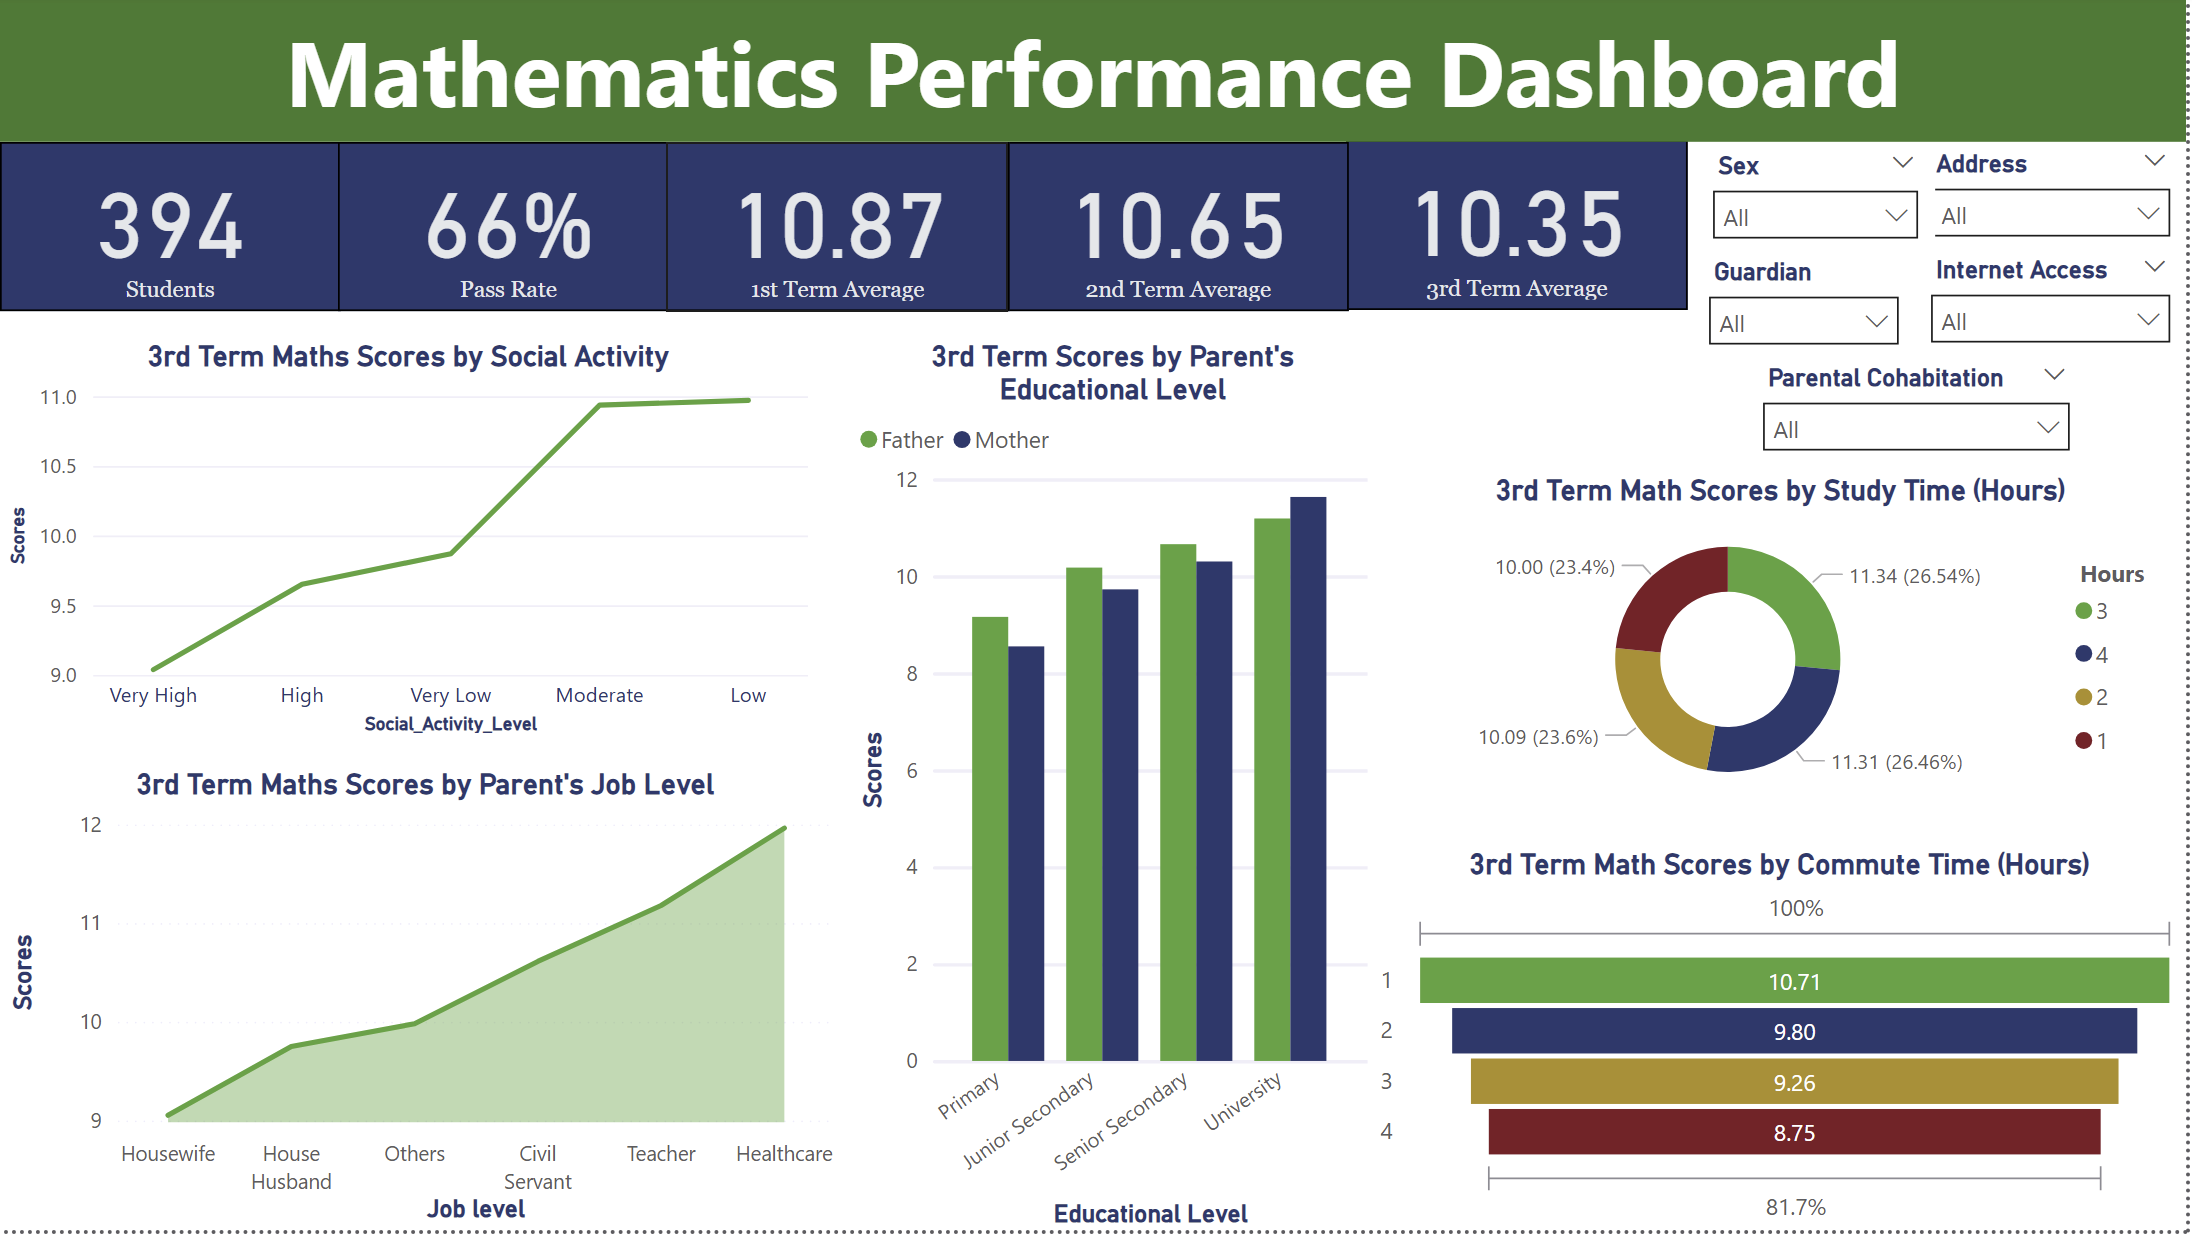
MATHS PERFORMANCE